
In Yalta, K., Ozturk, S., & Yetkin, E. (2016). “Golden Ratio and the heart: A review of divine aesthetics”,
In Yalta, K., Ozturk, S., & Yetkin, E. (2016). “Golden Ratio and the heart: A review of divine aesthetics”,
Difference between two binomial random variables (the Danish Mask Study)
The Danish Mask Study presents the interesting probability problem: the odds of getting 5 infections for a group of 2470, vs 0 for one of 2398. It warrants its own test statistic which allows us to look at all conditional probabilities. Given that we are dealing with tail probabilities, normal approximations are totally out of order. Further we have no idea from the outset on whether the sample size is sufficient to draw conclusions from such a discrepancy (it is).
There appears to be no exact distribution in the literatrue for \(Y=X_ 1-X_2\) when both \(X_1\) and \(X_2\) are binomially distributed with different probabilities. Let’s derive it.
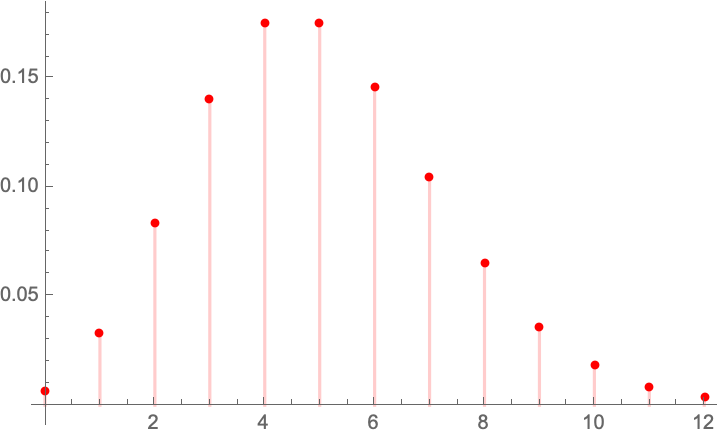
Let \(X_1 \sim \mathcal{B}\left(n_1,p_1\right)\), \(X_2 \sim \mathcal{B}\left(n_2,p_2\right)\), both independent.
We have the constrained probability mass for the joint \(\mathbb{P}\left(X_1=x_1,X_2=x_2\right)=f\left(x_2,x_1\right)\):
\(f\left(x_2,x_1\right)= p_1^{x_1} p_2^{x_2} \binom{n_1}{x_1} \binom{n_2}{x_2} \left(1-p_1\right){}^{n_1-x_1} \left(1-p_2\right){}^{n_2-x_2} \),
$latex x_1\geq 0\land n_1-x_1\geq 0\land x_2\geq 0\land n_2-x_2\geq 0 \$,
with \(x_1\geq 0\land n_1-x_1\geq 0\land x_2\geq 0\land n_2-x_2\geq 0\).
For each “state” in the lattice, we need to sum up he ways we can get a given total times the probability, which depends on the number of partitions. For instance:
Condition for \(Y \geq 0\) :
\(\mathbb{P} (Y=0)=f(0,0)=\)
\(\mathbb{P} (Y=1)=f(1,0)+f(2,1) \ldots +f\left(n_1,n_1-1\right)\),
so
\(\mathbb{P} (Y=y)=\sum _{k=y}^{n_1} f(k,k-y)\).
Condition for \(Y < 0\):
\(\mathbb{P} (Y=-1)=f(0,1)+f(1,2)+\ldots +\left(n_2-1,n_2\right)\),
alora
\(\mathbb{P} (Y=y)\sum _{k=y}^{n_2-y} f(k,k-y)\) (unless I got mixed up with the symbols).

The characteristic function:
\(\varphi(t)= \left(1+p_1 \left(-1+e^{i t}\right)\right){}^{n_1} \left(1+p_2 \left(-1+e^{-i t}\right)\right){}^{n_2}\)
Allora, the expectation: \(\mathcal{E}(Y)= n_1 p_1-n_2 p_2\)
The variance: \(\mathcal{V}(Y)= n_1^2 p_1^2 \left(\left(\frac{1}{1-p_1}\right){}^{n_1}\left(1-p_1\right){}^{n_1}-1\right)-n_1 p_1 \left(\left(\frac{1}{1-p_1}\right){}^{n_1}\left(1-p_1\right){}^{n_1}+p_1 \left(\frac{1}{1-p_1}\right){}^{n_1}\left(1-p_1\right){}^{n_1}+2 n_2 p_2 \left(\left(\frac{1}{1-p_1}\right){}^{n_1}\left(1-p_1\right){}^{n_1} \left(\frac{1}{1-p_2}\right){}^{n_2}\left(1-p_2\right){}^{n_2}-1\right)\right)-n_2 p_2 \left(n_2 p_2\left(\left(\frac{1}{1-p_2}\right){}^{n_2}\left(1-p_2\right){}^{n_2}-1\right)-\left(\frac{1}{1-p_2}\right){}^{n_2}\left(1-p_2\right){}^{n_2+1}\right)\)
The kurtosis:
\(\mathcal{K}=\frac{n_1 p_1 \left(1-p_1\right){}^{n_1-1} \, _4F_3\left(2,2,2,1-n_1;1,1,1;\frac{p_1}{p_1-1}\right)-\frac{n_2 p_2 \left(\left(1-p_2\right){}^{n_2} \, _4F_3\left(2,2,2,1-n_2;1,1,1;\frac{p_2}{p_2-1}\right)+n_2 \left(p_2-1\right) p_2 \left(\left(n_2^2-6 n_2+8\right) p_2^2+6 \left(n_2-2\right) p_2+4\right)\right)+n_1^4 \left(p_2-1\right) p_1^4-6 n_1^3 \left(1-p_1\right) \left(1-p_2\right) p_1^3-4 n_1^2 \left(2 p_1^2-3 p_1+1\right) \left(1-p_2\right) p_1^2+6 n_1 n_2 \left(1-p_1\right) \left(1-p_2\right){}^2 p_2 p_1}{p_2-1}}{\left(n_1^2 p_1^2 \left(\left(\frac{1}{1-p_1}\right){}^{n_1} \left(1-p_1\right){}^{n_1}-1\right)-n_1 p_1 \left(-\left(\frac{1}{1-p_1}\right){}^{n_1} \left(1-p_1\right){}^{n_1}+p_1 \left(\frac{1}{1-p_1}\right){}^{n_1} \left(1-p_1\right){}^{n_1}+2 n_2 p_2 \left(\left(\frac{1}{1-p_1}\right){}^{n_1} \left(1-p_1\right){}^{n_1} \left(\frac{1}{1-p_2}\right){}^{n_2} \left(1-p_2\right){}^{n_2}-1\right)\right)-n_2 p_2 \left(n_2 p_2 \left(\left(\frac{1}{1-p_2}\right){}^{n_2} \left(1-p_2\right){}^{n_2}-1\right)-\left(\frac{1}{1-p_2}\right){}^{n_2} \left(1-p_2\right){}^{n_2+1}\right)\right){}^2} \)
Hypothesis Testing in the Presence of False Positives: the Flaws in the Danish Mask Study
Every study needs its own statistical tools, adapted to the specific problem, which is why it is a good practice to require that statisticians come from mathematical probability rather than some software-cookbook school. When one uses canned software statistics adapted to regular medicine (say, cardiology), one is bound to make severe mistakes when it comes to epidemiological problems in the tails or ones where there is a measurement error. The authors of the study discussed below (The Danish Mask Study) both missed the effect of false positive noise on sample size and a central statistical signal from a divergence in PCR results. A correct computation of the odds ratio shows a massive risk reduction coming from masks.
The article by Bundgaard et al., [“Effectiveness of Adding a Mask Recommendation to Other Public Health Measures to Prevent SARS-CoV-2 Infection in Danish Mask Wearers”, Annals of Internal Medicine (henceforth the “Danish Mask Study”)] relies on the standard methods of randomized control trials to establish the difference between the rate of infections of people wearing masks outside the house v.s. those who don’t (the control group), everything else maintained constant.
The authors claimed that they calibrated their sample size to compute a p-value (alas) off a base rate of 2% infection in the general population.
The result is a small difference in the rate of infection in favor of masks (2.1% vs 1.8%, or 42/2392 vs. 53/2470), deemed by the authors as not sufficient to warrant a conclusion about the effectiveness of masks.
We would like to alert the scientific community to the following :
- The Mask Group has 0/2392 PCR infections vs 5/2470 for the Control Group. Note that this is the only robust result and the authors did not test to see how nonrandom that can be. They missed on the strongest statistical signal. (One may also see 5 infections vs. 15 if, in addition, one accounts for clinically detected infections.)

- The rest, 42/2392 vs. 53/2470, are from antibody tests with a high error rate which need to be incorporated via propagation of uncertainty-style methods on the statistical significance of the results. Intuitively a false positive rate with an expected “true value” \(p\) is a random variable \(\rightarrow\) Binomial Distribution with STD \(\sqrt{n p (1-p)}\), etc.
- False positives must be deducted in the computation of the odds ratio.
- The central problem is that both p and the incidence of infection are in the tails!
Immediate result: the study is highly underpowered –except ironically for the PCR and PCR+clinical results that are overwhelming in evidence.
Further:
- As most infections happen at home, the study does not inform on masks in general –it uses wrong denominators for the computation of odds ratios (mixes conditional and unconditional risk). Worse, the study is not even applicable to derive information on masks vs. no masks outside the house since during most of the study (April 3 to May 20, 2020), “caf
Floor functions using complex logarithms
An interesting discovery, thanks to a problem presented by K. Srinivasa Raghava:
A standard result for \(x\) real, where \(\lfloor .\rfloor\) is the floor function:
\(\lfloor x\rfloor =\frac{1}{\pi }\sum _{k=1}^{\infty } \frac{\sin (2 \pi k x)}{k}+x-\frac{1}{2}\).
Now it so happens that:
\(\frac{1}{\pi }\sum _{k=1}^{\infty } \frac{\sin (2 \pi k x)}{k}=\frac{i \left(\log \left(1-e^{-2 i \pi x}\right)-\log \left(1-e^{2 i \pi x}\right)\right)}{2 \pi }\)
which is of course intuitive owing to Riemann surfaces produced by the complex logarithm. I could not find the result but I am nearly certain it must be somewhere.
Now to get an idea, let us examine the compensating function \(f(x)= \frac{i \left(\log \left(1-e^{-2 i \pi x}\right)-\log \left(1-e^{2 i \pi x}\right)\right)}{2 \pi } \)

And of course, the complex logarithm (here is the standard function, just to illustrate):
